Published
5 years ago on
November 09, 2018
Is Bitcoin (BTC) Bullish Or Bearish?


Altcoins
April 22, 2024
Dogeverse Crypto Presale Now 50% Sold Out, Ends Soon - Next Big Meme Coin?
Altcoins
April 22, 2024
Exploring the Best Places to Make Crypto

Altcoins
April 22, 2024
eTukTuk Crypto Presale Launches Mobile Game On App Store And Google Play

Breaking News
April 22, 2024
$60 Million USDT Already Issued On TON, Great Start, Says CEO

Breaking News
April 22, 2024
The day the world woke up and realised that Bitcoin could save it

Opinion
April 22, 2024
Bitcoin continues to rally as war threat recedes
PR
April 22, 2024
De.Fi Presented its Accelerator & Announced the First Raise on April 29th
PR
April 22, 2024
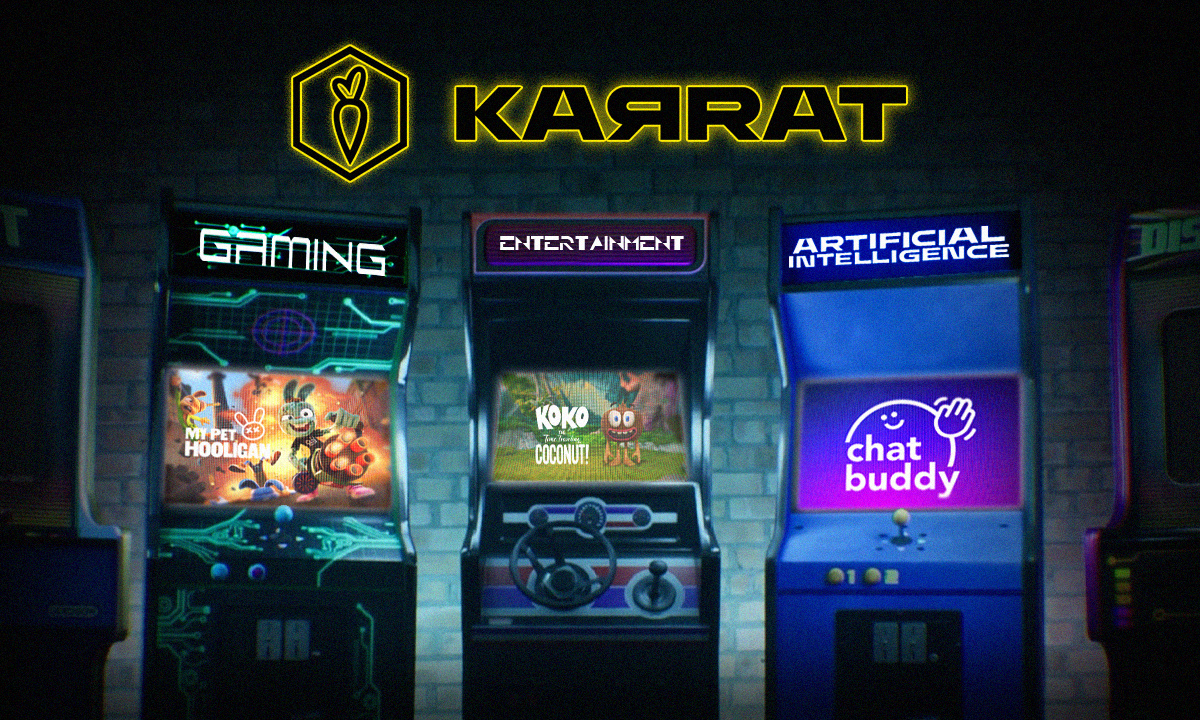
Unveiling the KARRAT Protocol: Pioneering the Next Era of Gaming, Entertainment, and AI Innovation, Reshaping Hollywood and Beyond

PR
April 22, 2024