Published
1 year ago on
February 22, 2023

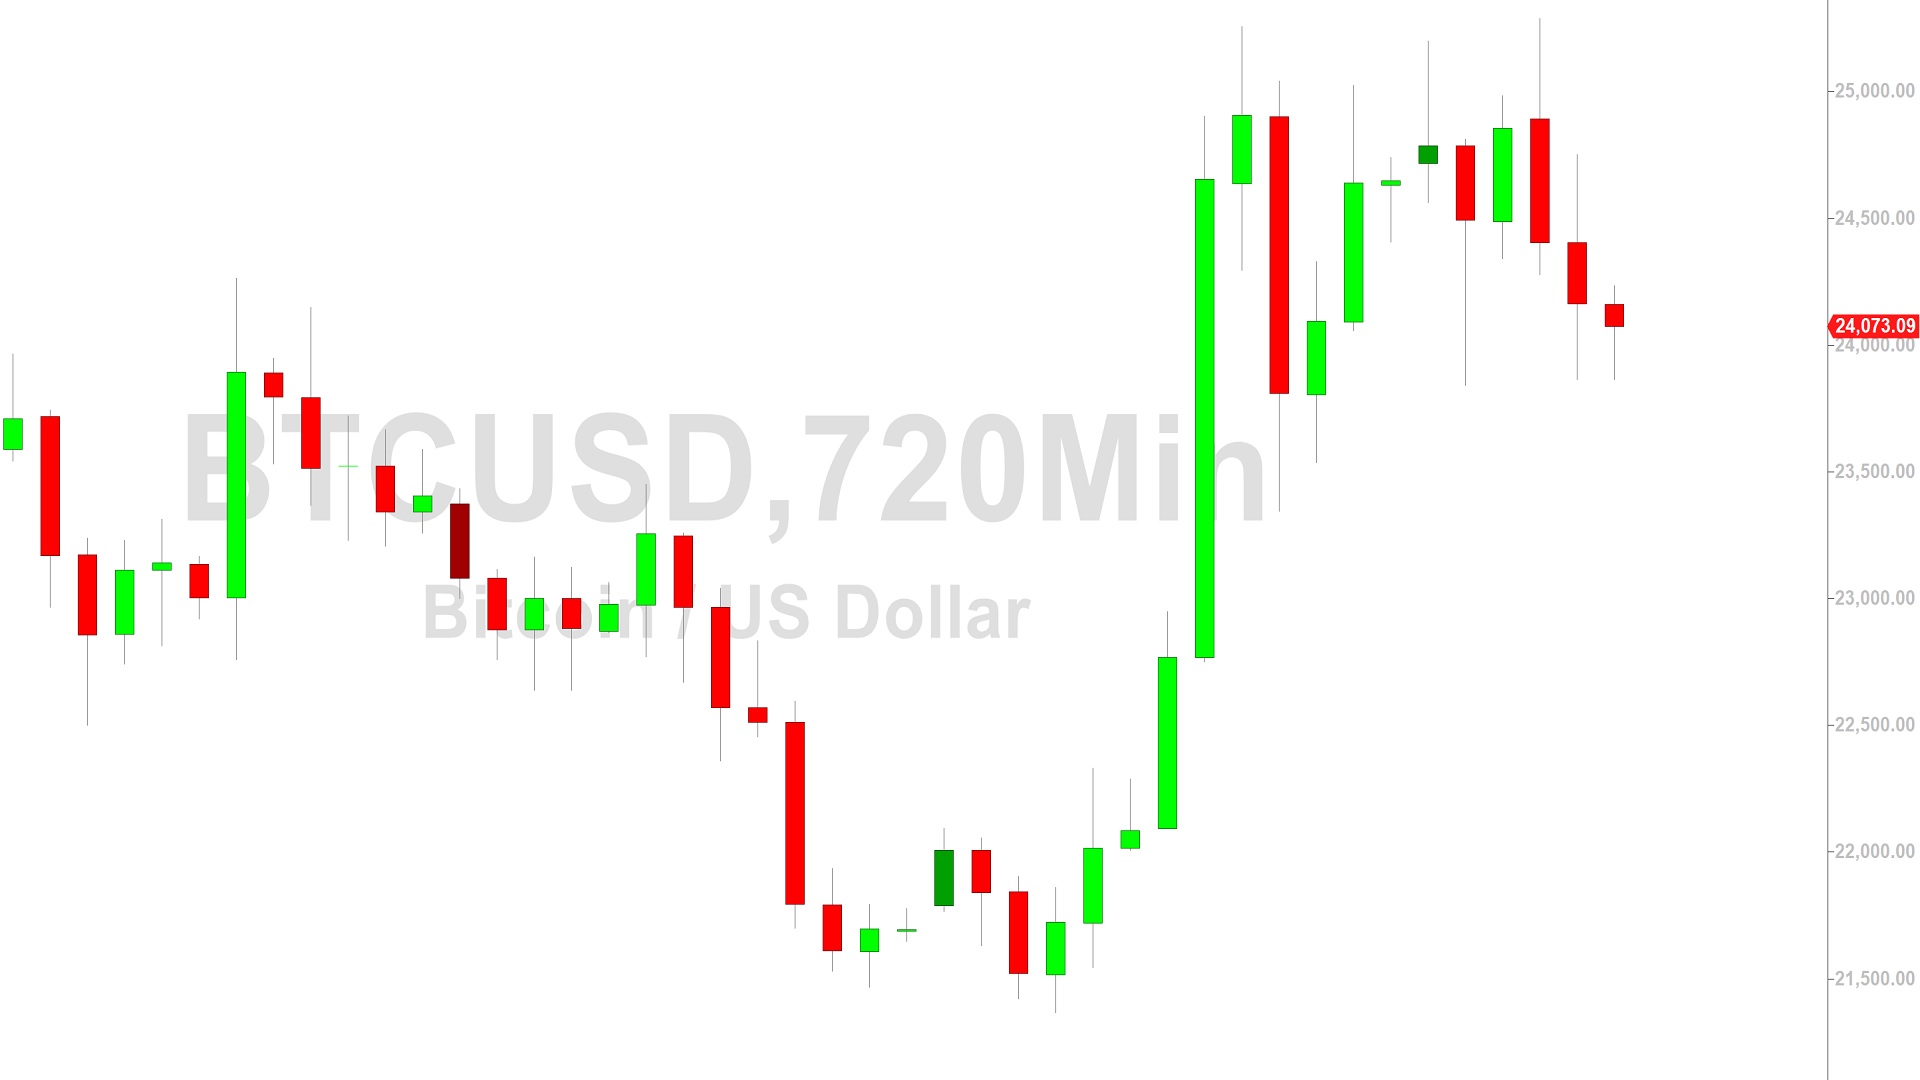
BTC/USD Orbiting 24000: Sally Ho’s Technical Analysis – 23 February 2023
Bitcoin (BTC/USD) continued to orbit the 24000 figure early in the Asian session as the pair continued to trade above the 23790.51 level, representing the 38.2% retracement of the appreciating range from 21366.45 to 25288.88. After establishing a fresh multi-month high around the 25288.88 area, BTC/USD depreciated and has twice tested the 23836.29 area, a downside price objective related to selling pressure that strengthened around the 24786.92 area. Additional downside price objectives include the 23839, 23732, 23496, 23364, 22943, and 22770 levels. The move higher to 25288.88 also represented a test of the 25455 level, an upside price objective related to historical buying pressure around the 16326.16 and 20333.33 areas. Upside price objectives related to buying pressure around the 16326.16 area include the 25455, 25774, 27609, and 28004 levels.
Upside price objectives related to buying pressure around the 15460 area include the 26612, 26931, 29244, and 29639 levels. Following the recent move higher to multi-month highs, technical support levels and areas of potential buying pressure are around the 22944, 22717, 23171, 22236, 22201, 21523, 21514, 21416, 21366, and 20791 areas. Stops are cited below the 21047, 20874, 20724, and 20370 levels. Below current price activity, technically significant areas include the 15900, 15512, 15313, 14500, 14364, 13369, 10727, 10432, 9682, 8837, and 7538 levels. Traders are observing that the 50-bar MA (4-hourly) is bullishly indicating above the 100-bar MA (4-hourly) and above the 200-bar MA (4-hourly). Also, the 50-bar MA (hourly) is bearishly indicating below the 100-bar MA (hourly) and above the 200-bar MA (hourly).
Price activity is nearest the 50-bar MA (4-hourly) at 23755.69 and the 50-bar MA (Hourly) at 24458.21.
Technical Support is expected around 18390.99/ 16714.46/ 14500.15 with Stops expected below.
Technical Resistance is expected around 25455.06/ 25774.41/ 26612.64 with Stops expected above.
On 4-Hourly chart, SlowK is Bearishly below SlowD while MACD is Bearishly below MACDAverage.
On 60-minute chart, SlowK is Bearishly below SlowD while MACD is Bullishly above MACDAverage.
Disclaimer: Sally Ho’s Technical Analysis is provided by a third party, and for informational purposes only. It does not reflect the views of Crypto Daily, nor is it intended to be used as legal, tax, investment, or financial advice.
Investment DisclaimerHalving Hype: Runes Protocol Poised to Reshape Bitcoin's Token Economy
Bitcoin is finished? Think again